Here’s a year-by-year list, noting significant events that influenced Bitcoin’s market cap increases:
• 2009: Bitcoin launched, mined for the first time by Satoshi Nakamoto. Early adoption among cryptography enthusiasts, though its market cap was negligible.
• 2010: First real-world transaction (10,000 BTC for two pizzas), giving Bitcoin initial value and spurring interest in its potential for transactions.
• 2011: Reached parity with the U.S. dollar, drawing attention from media and tech communities, sparking initial speculative interest.
• 2012: First halving event, reducing Bitcoin mining rewards by half, creating a scarcity effect that started to influence its value over time.
• 2013: Rapid rise in price after more mainstream media coverage, reaching $1.2 billion in market cap; Bitcoin exchanges begin to grow, increasing accessibility.
• 2014: Bitcoin’s usage expands into more mainstream platforms, but high-profile exchange Mt. Gox collapses, leading to volatility. Despite this, interest continues.
• 2015: Increased interest in blockchain technology from financial institutions like banks, raising Bitcoin’s profile and driving investment.
• 2016: Second halving event, reducing the block reward again, adding to the scarcity effect and anticipation of a price rise; Japan recognizes Bitcoin as a legal method of payment.
• 2017: Major bull run, with Bitcoin breaking $100 billion in market cap due to increased institutional interest and media hype, peaking in December at close to $20,000.
• 2018: Although volatile, Bitcoin’s market cap fluctuates between $50 billion and $100 billion as it becomes a recognized asset class but faces regulatory challenges.
• 2019: Bitcoin sees renewed interest as institutional investment products like Bitcoin futures launch, helping stabilize its role in the financial markets.
• 2020: Bitcoin crosses $250 billion due to global uncertainty from the COVID-19 pandemic, with investors turning to it as a hedge against inflation.
• 2021 (February): Bitcoin hits $1 trillion in market cap as corporations like Tesla announce Bitcoin investments, fueling a dramatic price surge.
• 2021 (November): Bitcoin reaches $1.28 trillion after hitting an all-time high of around $67,000; increasing mainstream adoption and launch of the first Bitcoin ETF in the U.S.
• 2022: Market cap fluctuates amid global economic uncertainty, regulatory pressures, and interest rate changes, averaging between $500 billion and $1 trillion.
• 2023: Continued volatility but strong interest from investors who view it as a hedge against inflation and a store of value, averaging around $800 billion.
• 2024: Market cap at approximately $1.248 trillion as of October, driven by broader adoption in the financial sector and optimism about upcoming halving in 2024.
These events highlight how institutional interest, regulatory developments, scarcity (due to halvings), and global economic factors have contributed to Bitcoin’s market cap growth over time.
Here’s a list showing Bitcoin’s market cap growth for each year from 2009 to 2024, highlighting significant milestones:
• 2009: 0,
• 2010: Minimal market cap, value largely negligible,
• 2011: Under $0.1 billion,
• 2012: Still below $0.1 billion,
• 2013: $1.2 billion,
• 2014: Approximately $5 billion,
• 2015: Around $4 billion, slight decline,
• 2016: $10 billion,
• 2017: $100 billion (October),
• 2018: Varied between $50 billion and $100 billion due to market volatility,
• 2019: $130 billion,
• 2020: $250 billion,
• 2021 (February): $1 trillion,
• 2021 (November): $1.28 trillion,
• 2022: Fluctuating, largely ranging between $500 billion and $1 trillion,
• 2023: Averaged around $600 billion to $1 trillion,
• 2024: Approximately $1.248 trillion (October).
This reflects major shifts, especially during periods of rapid adoption and volatility.
…
Here’s the list formatted as requested, with each year separated by commas:
• 2009: 0,
• 2013: 1.2 billion,
• 2017: 100 billion,
• 2020: 250 billion,
• 2021 (February): 1 trillion,
• 2021 (November): 1.28 trillion,
• 2024: 1.248 trillion
…
Year,Market Cap (Billion USD)
2009,0
2013 (May),1.2
2017 (Oct),100
2020,250
2021 (Feb),1000
2021 (Nov),1280
2024,1248
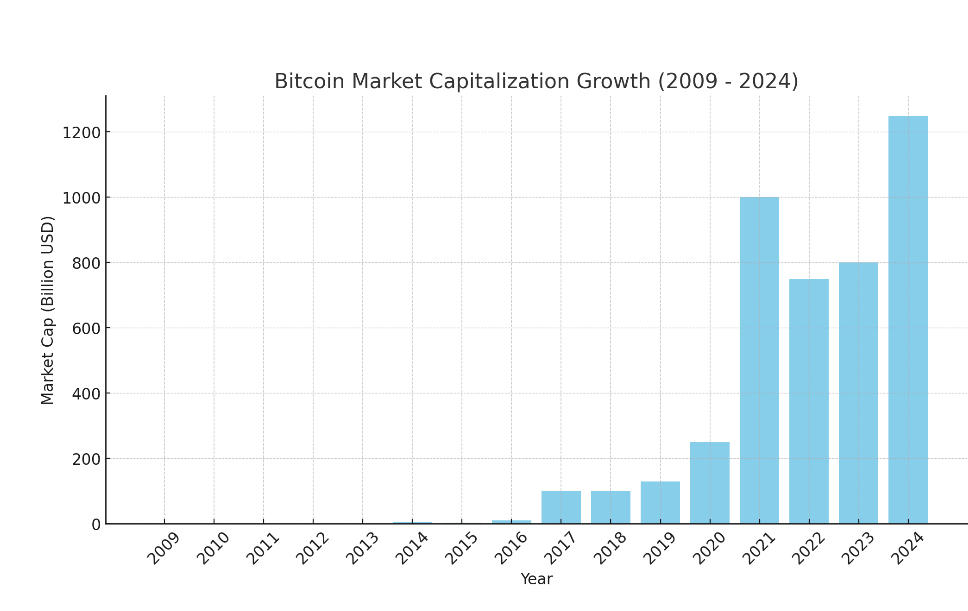
To visualize the growth of Bitcoin’s market capitalization from its inception, we can look at key milestones. Bitcoin first appeared on the scene in 2009 with a negligible market cap due to its extremely low price and limited recognition. By May 2013, Bitcoin’s market cap had reached approximately $1.2 billion. It wasn’t until late 2017 that Bitcoin broke the $100 billion mark, achieving this milestone in October. From that point, its market cap increased rapidly, reaching about $250 billion by early 2020 and then crossing the $1 trillion mark in February 2021, fueled by increased mainstream adoption and institutional investment.
Bitcoin’s market cap reached an all-time high of around $1.28 trillion in November 2021, aligning with its peak price at the time of roughly $67,000. Since then, despite experiencing some volatility, Bitcoin’s market cap has fluctuated around the $1 trillion mark, with its latest value recorded at approximately $1.248 trillion as of October 2024 .
I’ll create a graph based on this historical data, which will help illustrate the overall growth trend.